IDEA Fitness Industry Compensation Survey 2006
This biennial portrait of wages and benefits in the fitness industry shows a largely positive picture and affords a number of insights.
Rapid growth in the fitness industry will continue to fuel work opportunities, according to the U.S. Department of Labor. In fact, employment is expected to increase “much faster than the average for all occupations through 2014” (U.S. Department of Labor 2006a). This trend derives not simply from aging Baby Boomers’ concerns about health and fitness. Three other societal shifts propelling industry growth include the documented value of employee fitness and wellness programs in industry; the rise of adolescents’ and children’s club memberships, driven by the decline in school-based physical education programs; and increased club memberships among young adults, supported by higher incomes and concerns about fitness.
IDEA studies (Gavin & Gauvin 2001a, 2001b) consistently indicate that fitness industry employees have exceptionally high levels of work satisfaction. Salary surveys (Ryan 2003, 2005) have also documented forward movement in compensation packages for employees and independent contractors within the industry. This latest biannual report on compensation continues to offer encouraging signs for the industry, while also identifying areas meriting attention.
There is little doubt about fitness industry employees’ commitment to their jobs. The three most recent industry compensation surveys (2002, 2004, 2006) have yielded essentially the same finding: 81%–83% of employees remain in their jobs for 1 year or more. Though employee motivation is strongly derived from an individual’s passion for his or her work, compensation plays a pivotal role in satisfaction and retention.
According to the U.S. Department of Labor (2006b), the average hourly rate for private-sector production or nonsupervisory workers was $16.99 in October 2006, when IDEA’s latest survey was undertaken. This survey shows that fitness instructors average $20.25 per hour, while rates for specialty instructors, yoga/Pilates instructors, group fitness instructors and personal trainers range from $23.75 to $30.50 per hour, on average. Only for the entry-level position of fitness floor staff do wages fall significantly below the U.S. norm, with an average hourly rate of $10.
Knowing how fitness jobs are positioned within the wider employment market can help keep the industry competitive. However, with increasing numbers of career fitness professionals, progressive salary changes within the industry are perhaps equally important. To help gauge industry trends, IDEA has been conducting salary surveys since 1997. Employees who can see their earnings grow at or better than the pace of inflation will have more than ample rationale for renewed commitment to their professions, their clients and their organizations.
The biannual IDEA salary survey is more than a report on wages. It offers insights into what employers value when they are hiring, promoting or determining pay. Owners and managers responded to this survey not only with details about current practices but also with projections for the future. Indications of 2007 salary or wage increases vary. The majority of fitness/program directors (68%), personal training directors (65%) and group exercise coordinators (60%) may be slated for salary increases this year, while roughly half of all staff positions can reasonably expect wage increases this year.
In any discussion of earnings, inflation must be considered. Corresponding to the time frame of the most recent IDEA surveys (October 2004 and October 2006), the Bureau of Labor (BLS) statistics reported the average hourly wage for private-sector production or nonsupervisory workers to be $15.82 in October 2004 and $16.99 in October 2006 (U.S. Department of Labor 2006b). Factoring in inflation with the help of BLS’s inflation calculator, we find that the 2004 U.S. hourly average equates to $16.88 in 2006 dollars—11 cents less than the actual October 2006 rate. The message here is that hourly wages in the U.S. kept slightly ahead of inflation during the period of these surveys (www.bls.gov/news.release/empsit.t16.htm).
How have fitness industry salaries and wages fared? Wages and salaries have outpaced inflation for personal training directors, group exercise coordinators, group fitness instructors and specialty
instructors. Increases in fitness floor staff earnings have kept abreast of inflation, while those for fitness/program directors and yoga/
Pilates instructors have not. On the downside, not only are the earnings of personal trainers and fitness instructors lower in this survey than in 2004, but the effects of inflation deepen the decline.
Another important contrast afforded by the IDEA survey concerns earnings in nonprofit versus for-profit clubs. Results are mixed. Both fitness/program directors and group exercise coordinators earn significantly better salaries in nonprofit organizations than in for-profit settings (there is no reliable difference in salaries for personal trainer directors). However, for those groups predominantly paid an hourly wage, the profit sector
offers better wages. The only exception here is for floor staff, who are comparably paid in both types of clubs.
Information is a powerful force in decision making. More than merely analyzing results, IDEA’s survey serves as a guide to decision makers. Through intra- and inter-industry comparisons, it allows employers to reconsider their perspectives about wages and salaries in the spirit of equity and to further motivate their dedicated staff.
Overview of Positions
Nine fitness industry positions were examined in the 2006 IDEA survey. Highlights of our findings are offered below, while detailed results are provided in tables at the end of this article.
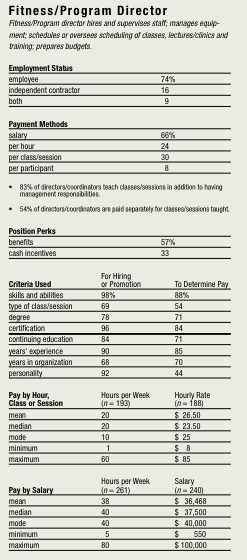
Fitness/Program and Personal Training Directors average 38 hours a week when they are salaried, but only 20 hours per week when their jobs are compensated on an hourly basis. Compared with 2004 survey results, the percent in this category who are paid salaries is down from 78% in 2004 to 66% in current findings. More strikingly, a lower percent of directors (57%) than in 2004 (70%) are eligible for benefits. Since about 83% of directors and coordinators teach classes for which they may be paid extra, total income can be somewhat higher. According to the U.S. Department of Labor’s inflation calculator, which factors in the average Consumer Price Index for a given year, salaried fitness/program directors may actually have lost ground over the past 2 years. Their average annual salary of $35,233 in 2004 would need to have been $37,679 in 2006 to provide them equal buying power. While the average salary is currently higher ($36,468) than in 2004, adjusting this figure for inflation suggests a slight decline.
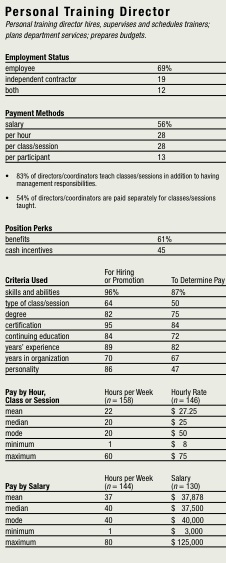
Personal Training, or PFT, Directors similarly average more hours per week when they are salaried (37 hours) than when they are paid an hourly wage (22 hours). About the same percentage of PFT directors are salaried (56%) as were in 2004 (59%). Salaries may also have been augmented by teaching classes and perhaps conducting individual sessions. The 2006 study shows a significant leap in salaries, to an average of $37,878 annually. This is well above the 2004 average of $30,956, even after adjustment for inflation ($33,020). The majority of PFT directors receive benefits (61%), though this percentage reflects a slight decline from 2004 (68%).
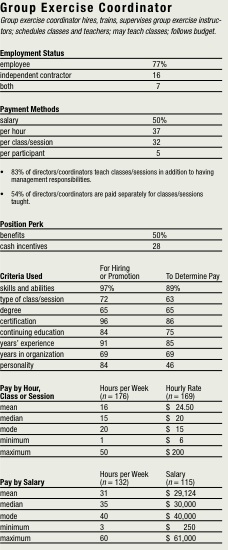
Group Exercise Coordinator often represents a transitional position divided between management and staff responsibilities. About half of those in this category (52% in 2004 and 50% in 2006) are paid salaries, while the remainder are compensated by hourly wages or on the basis of classes or sessions offered. Salaried coordinators work about twice as many hours per week (31 hours), on average, as those paid otherwise (16 hours); these results are identical to those from the 2004 survey. Consistent with pay patterns, only half of the coordinators are eligible for benefits. As noted earlier, about 83% of coordinators may augment their pay by teaching extra classes. Great news is evident in the significant salary gains identified by comparing the 2004 survey with recent results. The current average is $29,124, compared with $23,176 in 2004 (or $24,734 when adjusted for inflation).
Personal Trainers are working more as employees than as independent contractors (50% vs. 38%), in contrast with the more equal distribution shown in 2004 results (45% vs. 43%). As in previous studies, only a small percentage (5%) of personal trainers are salaried, and—as might be expected—only 33% receive benefits (up from 29% in 2004). Trainers generally split their fees with their organizations, with the fee split remaining at about 60/40, similar to 2004 findings.
With the small number of salaried personal trainers, we focused on hourly rates, where results show a slight decline. Average hourly rates for 2006 are 75 cents lower, at $30.50, than for 2004. If we factor inflation into the analysis, the decline increases to about $2.85 per hour. Though trainers are able to compensate by increasing their weekly hours, the 2006 study reveals only a half-hour increase in average hours per week (18.5) over 2004.
Because the average hourly rate combines personal trainers who work as independent contractors and those who are employees, an important difference is masked. When we look at these two groups separately, a significant difference in rates becomes evident. Independent contractors average $38.25 per hour, while employees earn only $24.75 per hour. In terms of number of hours worked per week, differences are small: independents work about 17.7, while employees average 18.6.
Fitness Floor Staff positions are typically entry level, though in some clubs personal trainers and fitness instructors may devote some hours to floor duties. Not much has changed for this group since the 2004 survey. Most are employees (89%) who are paid by the hour (92%). They average 18 work hours per week, earning an average of $10 per hour. This rate is $0.75 higher than in 2004, though adjusting for inflation makes things about even ($9.87). One promising note is that more staff members are eligible for benefits (31% in 2006 vs. 24% in 2004).
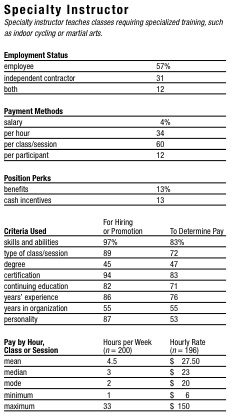
Group Fitness Instructors teach classes such as step and mixed-impact. Specialty Instructors teach classes requiring specialized training (e.g., indoor cycling or martial arts). Group fitness instructors average about 1 hour more per week than specialty instructors (5.5 vs. 4.5), with both groups within a half-hour of weekly averages noted in the 2004 study. Few of these individuals are salaried (3%–4%), though the majority are considered to be employees (57%–59%). Based on the last three surveys (2002, 2004 and 2006), individuals in these categories are increasingly considered as employees. From 2002 to 2006, rates increased from 49% to 59% for group fitness instructors and from 44% to 57% for specialty instructors. This has not translated, however, into higher rates of eligibility for benefits, which remain around 13%–14% for both groups. Another positive finding is that hourly rates have increased an average of $2 per hour for both groups over 2004. Factoring in the effects of inflation, group fitness instructors currently average $23.75 per hour, beating their inflation-adjusted 2004 rate by $0.54. Comparably, the most recent study shows that specialty instructors earn an hourly average of $27.50, keeping them barely ahead of inflation over 2004.
Pilates and Yoga Instructors average 6 hours per week, slightly higher than either group fitness or specialty instructors. Similar to other instructors, few (2%) are salaried and slightly less than half (49%) are classified as employees. Benefit eligibility (13%) is also comparable to the other groups. Though the average hourly pay for this group is the highest of all the instructors ($29.50), a comparison with the 2004 rate ($29) indicates that wages have not advanced at the same pace as the other instructors’, nor have they kept abreast of inflation.
Fitness Instructors work in both one-on-one and group environments. This title is also found in wellness or recreation programs in corporations, colleges and hospitals. Fitness instructors work significantly more than other instructors, averaging 13.5 hours per week, up a half-hour from the 2004 survey. They are more likely than group fitness, specialty and Pilates/yoga
instructors to be paid by the hour than by the class or session. Average hourly pay is the lowest of all the instructor groups ($20.25), declining by $1.25 per hour from 2004. When inflation is accounted for, this lower rate of compensation becomes more significant.
Regional Differences
in Wages and Salaries
Living costs vary by region, and accordingly so do wages and salaries. The 2006 IDEA salary survey allowed regional comparisons of average pay rates for fitness professionals located in the Northeastern, North Central, Southern and Western states and Canada. For all nine job categories, statistically significant differences were found. Three of the nine job categories are predominantly salaried, and the rest are paid hourly.
Salaries for fitness/program directors are significantly higher in the Northeast, averaging $41,018, compared with all other U.S. regions, where salaries are roughly in the $35,000–36,000 range. Canadian salaries are the lowest, at $31,617. Similarly, personal training directors in the Northeast have the highest salaries. With an average annual pay of $48,091, Northeasterners earn over $13,600 more (on average) than those in the lowest-paid region, the Western U.S., and about $10,000 more than any other U.S. area. Again, the Canadian average ranks last, at $31,156. This trend does not hold for group exercise coordinators, however. On average, the highest-paid coordinators are located in Canada, with an average annual salary of $36,005, compared with the U.S. regions, which range from a low of $27,266 (Northeast) to a high of $32,895 (North Central).
The highest hourly wages for fitness professionals vary considerably by region and position. Personal trainers, group fitness instructors, specialty instructors, yoga/Pilates instructors and fitness instructors in the Northeast have the highest average hourly wages. Personal trainers, for instance, average $35 per hour in the Northeast, while ranging from $24.25 in Canada to $31.25 in the Western states. Specialty instructors earn an average of $36.25 in the Northeast, and as little as $20.50 in the North Central states. Group fitness instructors range on average from a low of $20.50 (North Central) to a high of $27.75 (Northeast). Hourly wages for fitness instructors have a spread of about $6 per hour, with the lowest being in the North Central region ($17) and the highest being in the Northeast ($23.25).
The Northeast does not lead in hourly wages for only one group—namely, fitness floor staff. Fitness floor staff average $10.75 per hour in the Western states and $9.25 in both Southern and North Central U.S.; the Northeast averages $10.25 per hour.
We know that regional variations in wages and salaries are largely affected by market standards and cost of living. However, you might also want to consider whether some differences noted in this report might be due to varying job descriptions for these roles in regions across the U.S. and Canada.
Benefits and Discounts
Other forms of compensating personnel can be found in such benefits and perks as insurance plans, paid vacations, profit sharing and discounts. In general, full-time employees are more likely to be eligible for a wide range of benefits and discounts, while part-timers and independent contractors qualify less often. For instance, about half of full-time employees are eligible for commissions and incentives, while lower percentages of part-time employees and independent contractors receive these benefits. Similarly, 70% or more of full-timers are covered by health and liability insurance, in addition to receiving paid vacation time, while relatively few part-timers and independent contractors are granted such coverage. Discounts, however, seem to apply across the board: 67% of part-timers and 71% of full-timers are eligible for discounts, while 43% of independent contractors qualify.
In comparisons with the 2004 survey, trends are similar. There have been slight increases in full-timers covered by retirement plans (56% vs. 51%) and disability insurance (60% vs. 56%). These are positive signs for the industry.
Hiring and Promotion
When hiring and promoting individuals, what factors weigh most heavily? Though the answer depends partly on the individual’s role in the organization, in 2006 employers identified four factors as key, irrespective of role: an applicant’s skills and abilities rank first in importance across all nine job categories, while certifications typically rank second; personality and years of experience trade third and fourth rankings for most of the job categories. Beyond these four, university degrees are most relevant in hiring and promotion for fitness/program directors, personal training directors and personal trainers, but diminish in significance for other positions. As expected, the salience of type of class/session for hiring and promotion significantly
increases for those involved in teaching group, specialty or yoga/Pilates classes.
Do results differ between the 2004 and 2006 surveys? Though percentages have shifted a few points here and there, we noted no dramatic changes in criteria for hiring and promotion across the range of fitness industry positions.
Employers evaluated the same factors for their relevance in determining pay. In 2006, while personality ranks high in determinations of hiring and promotion, it drops close to last or next-to-last place in rankings for all positions when pay decisions are being made. Skills/abilities, certification and years’ experience form the “top 3” circle for all positions when pay is under consideration.
Similar to the hiring/promotion comparisons between 2004 and 2006 data, percentages have remained relatively constant across all factors evaluated in relation to pay determination.
Reflections on the Results
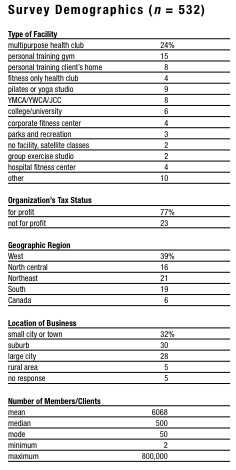
The stability of findings from IDEA’s past three biannual salary surveys tells us that the reading we obtained is highly reliable. From a sample of 532 owners and managers, we obtained a trustworthy portrait of compensation in the fitness industry. The picture is largely positive and affords a number of insights. It seems that employers place emphasis on appropriate criteria when evaluating employees for hiring, promotion and pay increases. Reflecting industry trends toward demanding credentialing programs, employers emphasize certification, skills and abilities in most personnel decisions. Moreover, personality—that ineffable quality distinguishing technicians from inspirational leaders—remains at the core of hiring and promotion decisions; it has far less to do with pay decisions.
A decade ago, industry norms were such that most employees would have been considered part-time or independent contractors. More and more, stability is emerging in the fitness industry. Significant numbers of individuals are now considered employees and thereby are entitled to wide-ranging benefits, discounts and profit sharing. In previous generations, anything less than a full-time position might have been seen as undesirable, but times have changed. As signified by Time Magazine’s designation of “you” as Person of the Year (Time, December 25, 2006/January 1, 2007), members of the current generation want flexibility and independence in their careers. Work profiles in the fitness industry provide that and more.
And the pay is pretty good! Industry wages are generally well above the U.S. hourly standard. Moreover, they are keeping abreast of the changing economy. Since 2004, wages and salaries have increased in seven of the nine positions we examined. Applying the more demanding criterion of whether increases beat the rate of inflation, positions showing gains drop to five, with two of these positions posting significant boosts. Where progress is less evident, employers may be encouraged to reassess policies and practices.
Sidebar: How Inflation Affects Earnings
Inflation is the “overall general upward price movement of goods and services in an economy,” according to the U.S. Bureau of Labor Statistics (BLS). Among other measurements of the economy, the BLS reports the Consumer Price Index (CPI) which measures inflation as experienced by consumers in their day-to-day living expenses.
If you are curious about how inflation affects your earnings, the Bureau has an online inflation calculator that uses the average CPI for a given year. You can put in a dollar amount and choose the year to compare it with at http://data.bls.gov/cgi-bin/cpicalc.pl.
Sidebar: Methadology
Beginning June 20, 2006, IDEA sent three e-mails to 5,046 members, inviting them to participate in an online survey related to compensation. The questionnaire was designed by Moder Research & Communications Inc., an independent market research firm, in collaboration with IDEA staff. The questionnaire consisted of 330 questions covering a variety of subjects related to compensation of persons currently working in a variety of health club settings.
The survey was programmed using Perseus Survey Solutions 7, a professional online survey program. The questionnaire was tested prior to the beginning of the survey to ensure accuracy of responses.
Following the initial invitation, follow-up invitations were sent on June 27 and July 10 to those members not responding. On July 17, 2006, the survey was taken offline. As of that date, 532 members had responded to the questionnaire for an overall response rate of 10.4%.The following confidence information is based on the population surveyed and the number of responses received: 95% confidence level; 4.04% margin of error.
Salaries are not shown for staff positions because there were too few respondents. Percentages of 0.5 and higher have been rounded up. Hours per week have been rounded to the nearest half-hour. Hourly wages have been rounded to the nearest 0.25%. Canadian dollars have been converted to U.S. dollars. When percentages do not add up to 100, it is because some respondents did not answer the question, the percentages have been rounded up or respondents gave multiple answers.
Sidebar: What the Terms Mean
A salary is a fixed amount of money paid to an employee. The salary does not vary according to the number of hours worked.
A wage is paid to hourly workers, who may be employees or independent contractors. In the fitness industry, wages are also paid for sessions/classes. A wage goes up or down depending on the number of hours worked.
For employees, owners are required by U.S. federal and state laws to contribute to Social Security, Medicare and other funds and to withhold income tax. Independent contractors pay their own taxes and contributions to Social Security, Medicare and other funds. For more information on each status, visit www.irs.gov.
The n is the number of people who answered a question. Of the people who answered, the percent (%) shows how many answered yes.
The mean, or average, is found by adding all the answers together and then dividing them by the number of respondents. Because of this, a mean can include extremely high and extremely low numbers.
The median is the midpoint, where half of the respondents answered above and half answered below. The median number is useful because it is not influenced by the extremes of high and low.
The mode is the most frequently given response. This tells you what the highest number (although it can be a very small number) of respondents answered.
Sidebar


References
Gavin, J.F., & Gauvin, F. 2001b. IDEA Personal Trainer Work Satisfaction Survey. IDEA Personal Trainer, 12 (7), 24–31.
Ryan, P. 2003. IDEA Fitness Industry Compensation Survey 2002. IDEA Health & Fitness Source, 21 (1), 51–58.
Ryan, P. 2005. IDEA Fitness Industry Salary Survey 2004. IDEA Fitness Journal, 2 (5), 43–50.
U.S. Department of Labor. 2006a. Occupational Outlook Handbook, 2006–07 Edition. www.bls.gov/oco/reprints/ocor010.pdf; retrieved Jan. 10, 2007.
U.S. Department of Labor. 2006b. Bureau of Labor Statistics. Average hourly and weekly earnings of production or non-supervisory private nonfarm payroll by industry. www.bls.gov/news.release/empsit.t16.htm; retrieved Jan. 10, 2007.
You. Person of the Year. Time Magazine, 168 (26), Dec. 25, 2006/Jan. 1, 2007.
Jim Gavin, PhD
Jim Gavin, PhD, is a professor of applied human sciences at Concordia University and has been involved in the practice of counseling and health promotion over the past 35 years.